Observe
Enable Sidecars in all workloads
An Istio sidecar proxy adds a workload into the mesh.
Proxies connect with the control plane and provide Service Mesh functionality.
Automatically providing metrics, logs and traces is a major feature of the sidecar.
In the previous steps we have added a sidecar only in the travel-control namespace’s control workload.
We have added new powerful features but the application is still missing visibility from other workloads.
Step 1
Switch to the Workload graph and select multiple namespaces to identify missing sidecars in the Travel Demo application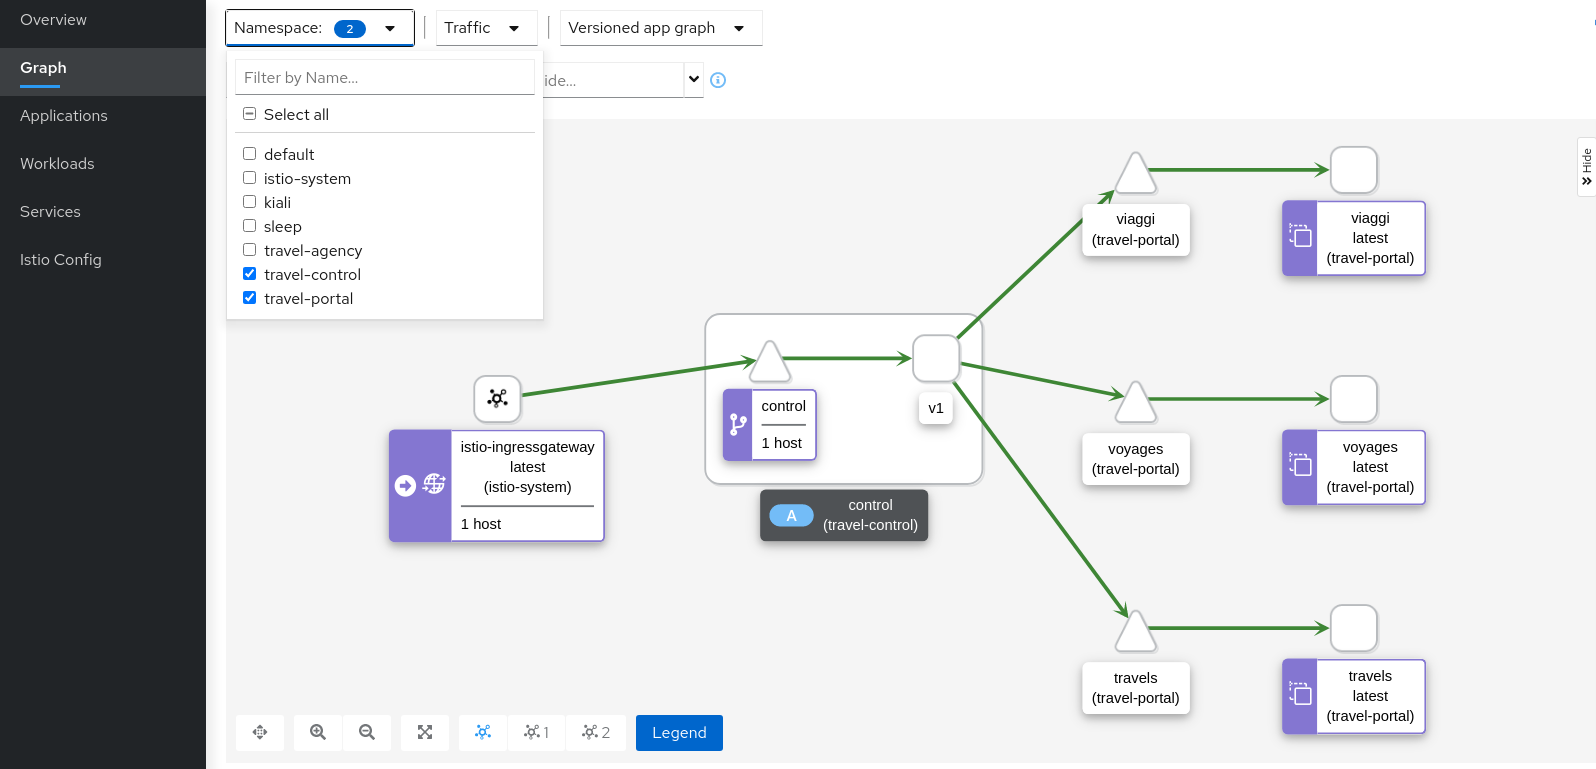
That control workload provides good visibility of its traffic, but telemetry is partially enabled, as travel-portal and travel-agency workloads don’t have sidecar proxies.
Step 2
Enable proxy injection in travel-portal and travel-agency namespacesIn the First Steps of this tutorial we didn’t inject the sidecar proxies on purpose to show a scenario where only some workloads may have sidecars.
Typically, Istio users annotate namespaces before the deployment to allow Istio to automatically add the sidecar when the application is rolled out into the cluster. Perform the following commands:
kubectl label namespace travel-agency istio-injection=enabled
kubectl label namespace travel-portal istio-injection=enabled

kubectl delete -f <(curl -L https://raw.githubusercontent.com/kiali/demos/master/travels/travel_agency.yaml) -n travel-agency
kubectl delete -f <(curl -L https://raw.githubusercontent.com/kiali/demos/master/travels/travel_portal.yaml) -n travel-portal

// Wait until all services, deployments and pods are deleted from the travel-agency and travel-portal namespaces

kubectl apply -f <(curl -L https://raw.githubusercontent.com/kiali/demos/master/travels/travel_agency.yaml) -n travel-agency
kubectl apply -f <(curl -L https://raw.githubusercontent.com/kiali/demos/master/travels/travel_portal.yaml) -n travel-portal
Verify that travel-control, travel-portal and travel-agency workloads have sidecars deployed:
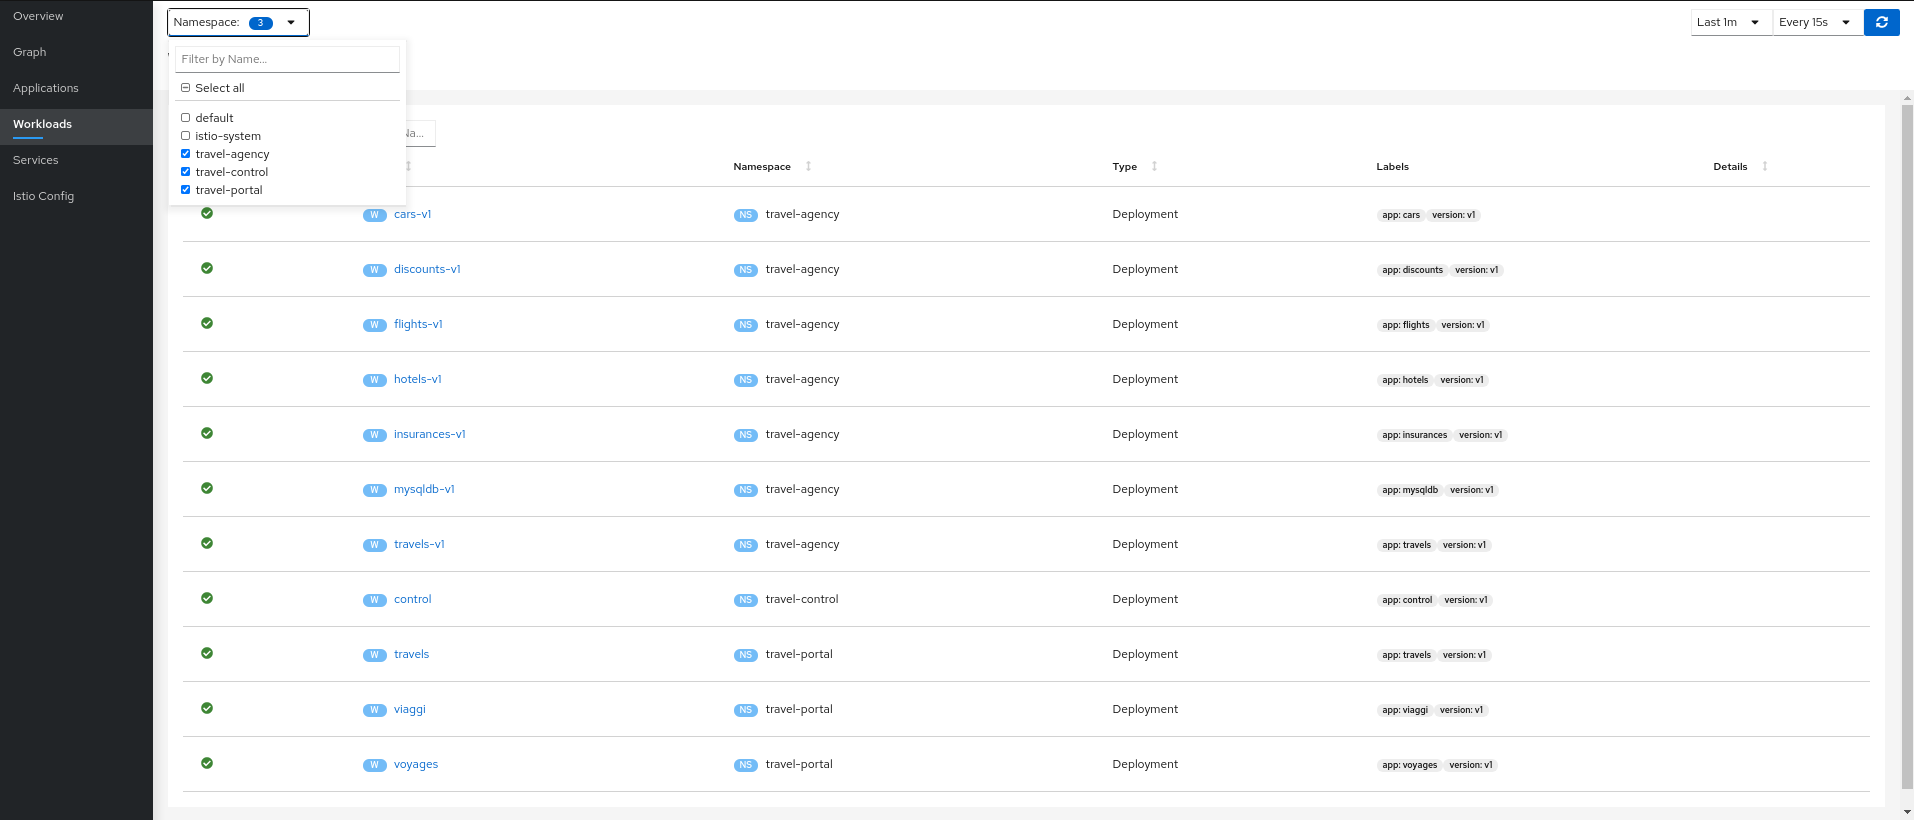
Step 3
Verify updated telemetry for travel-portal and travel-agency namespaces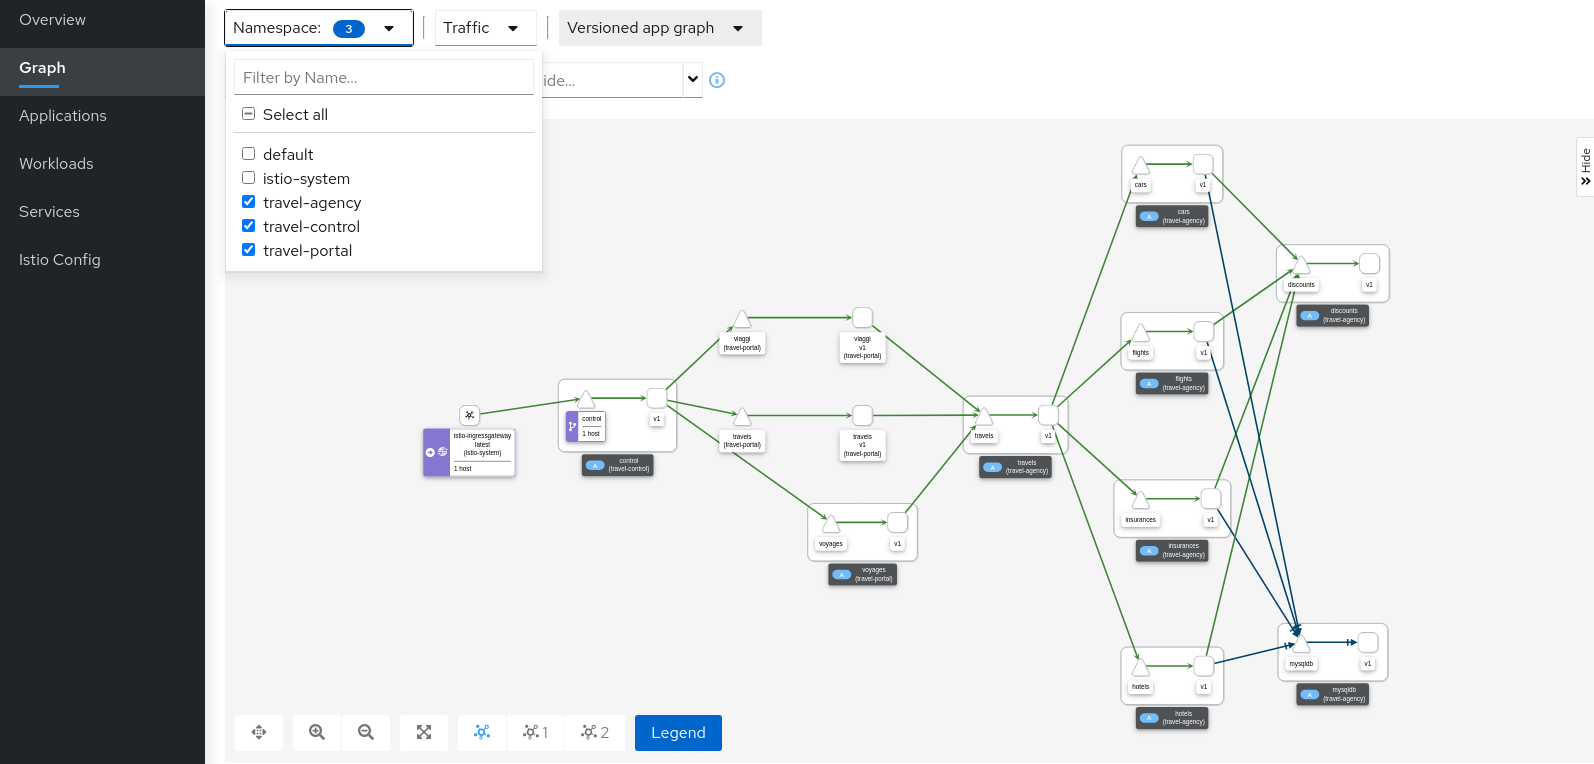
Graph walkthrough
The graph provides a powerful set of Graph Features to visualize the traffic topology of the service mesh.
In this step, we will show how to use the Graph to show relevant information in the context of the Travel Demo application.
Our goal will be to identify the most critical service of the demo application.
Step 1
Select all travel- namespaces in the graph and enable Traffic Distribution edge labels in the Display Options: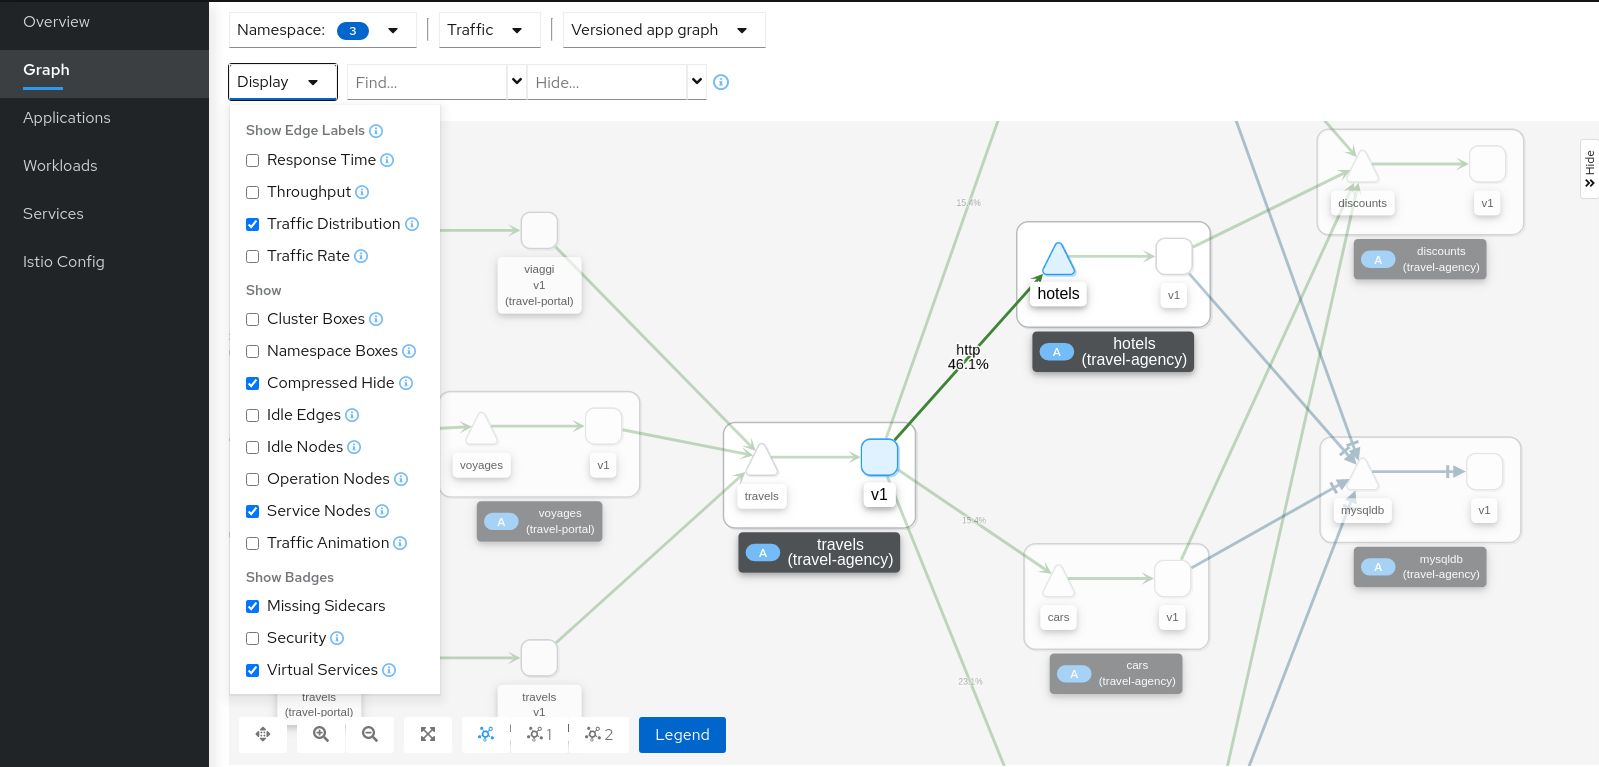
Review the status of the mesh, everything seems healthy, but also note that hotels service has more load compared to other services inlcuded in the travel-agency namespace.
Step 2
Select the hotels service, use the graph side-panel to select a trace from the Traces tab: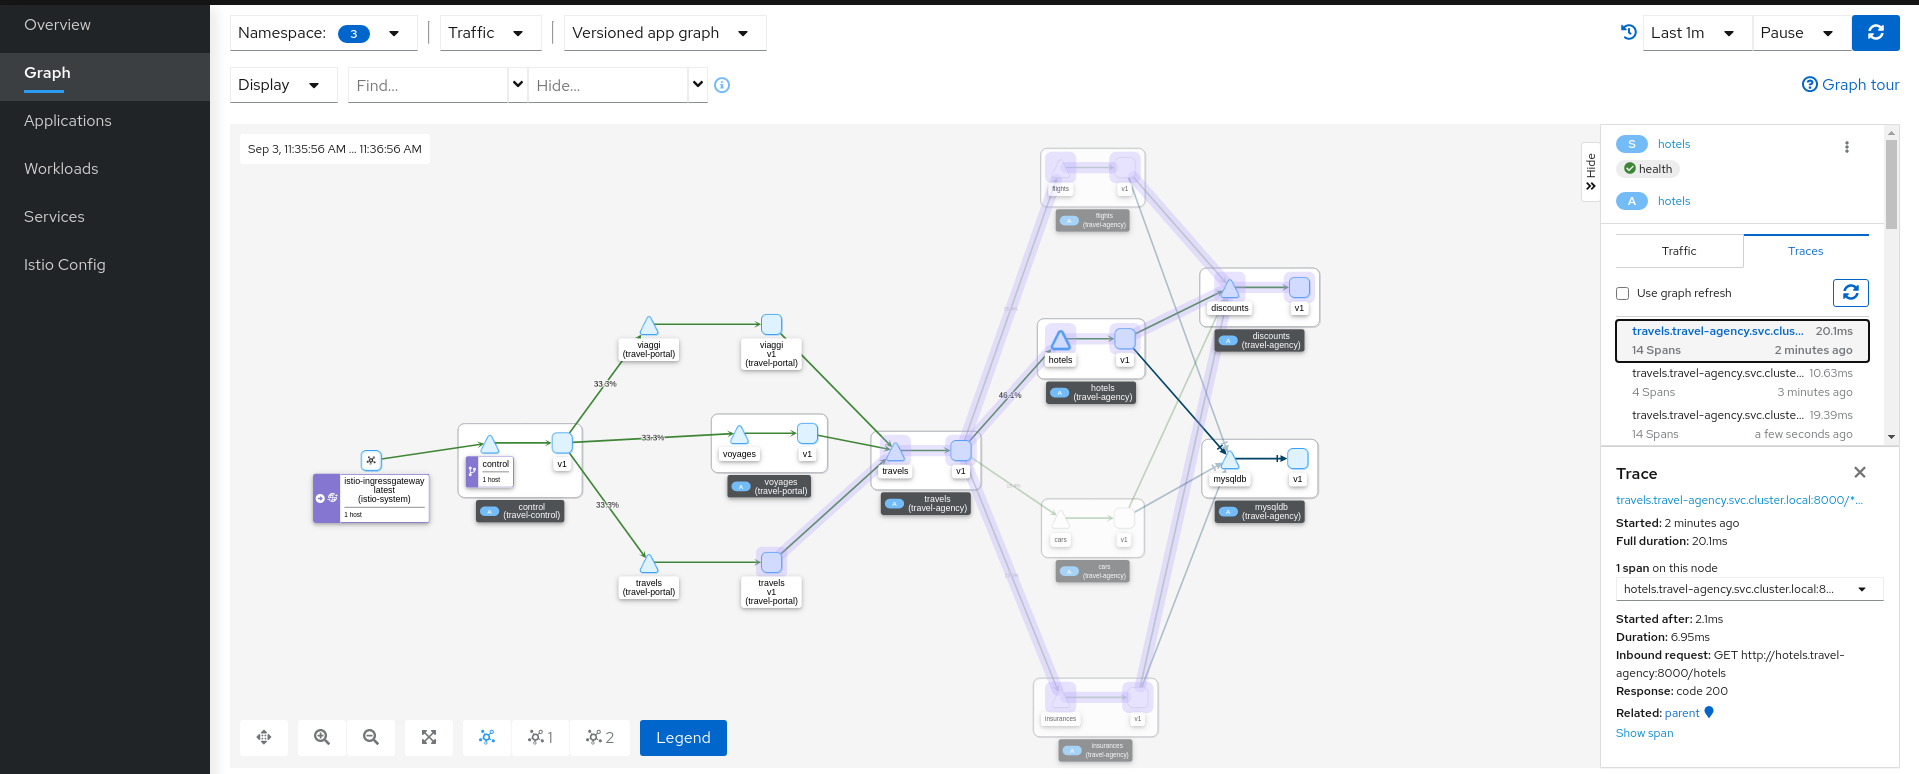
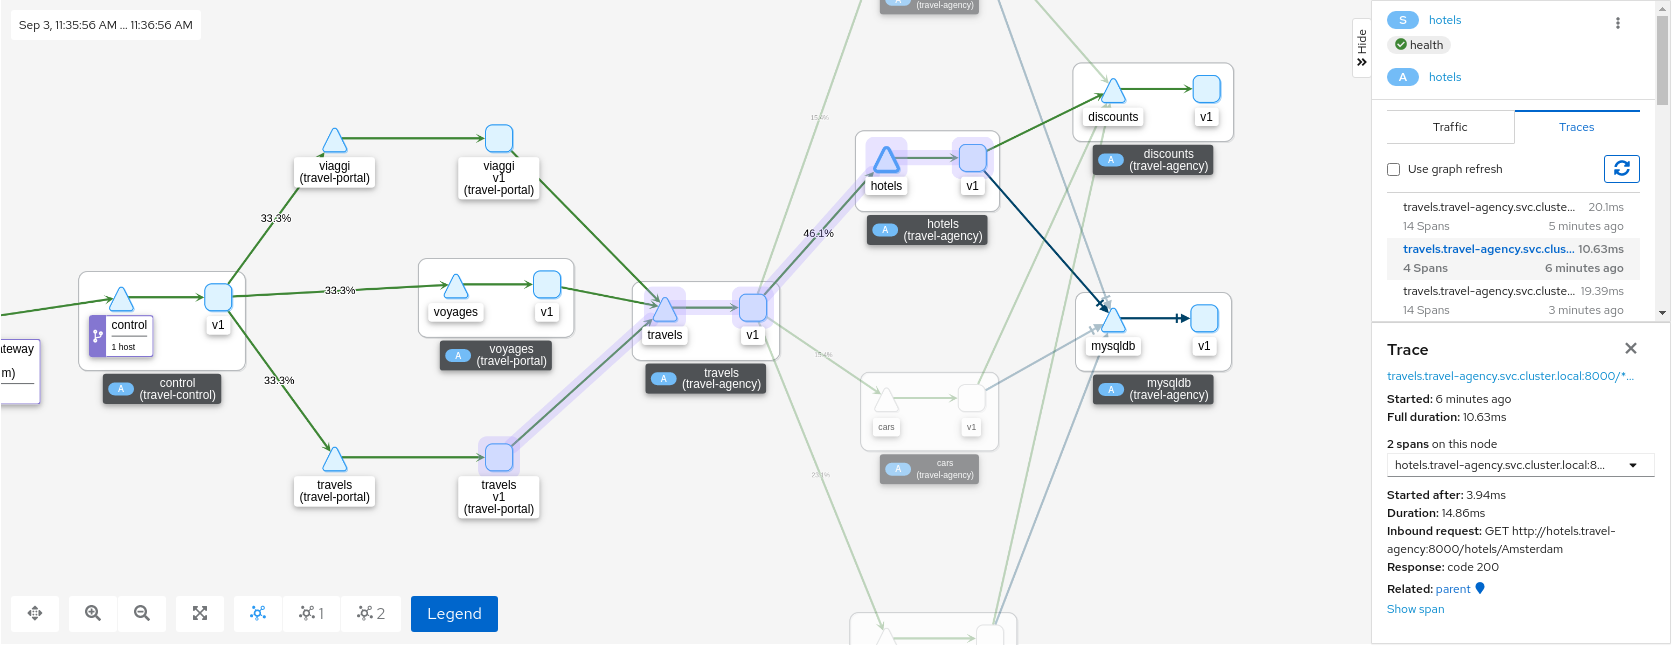
Combining telemetry and tracing information will show that there are traces started from a portal that involve multiple services but also other traces that only consume the hotels service.
Step 3
Select the main travels application and double-click to zoom in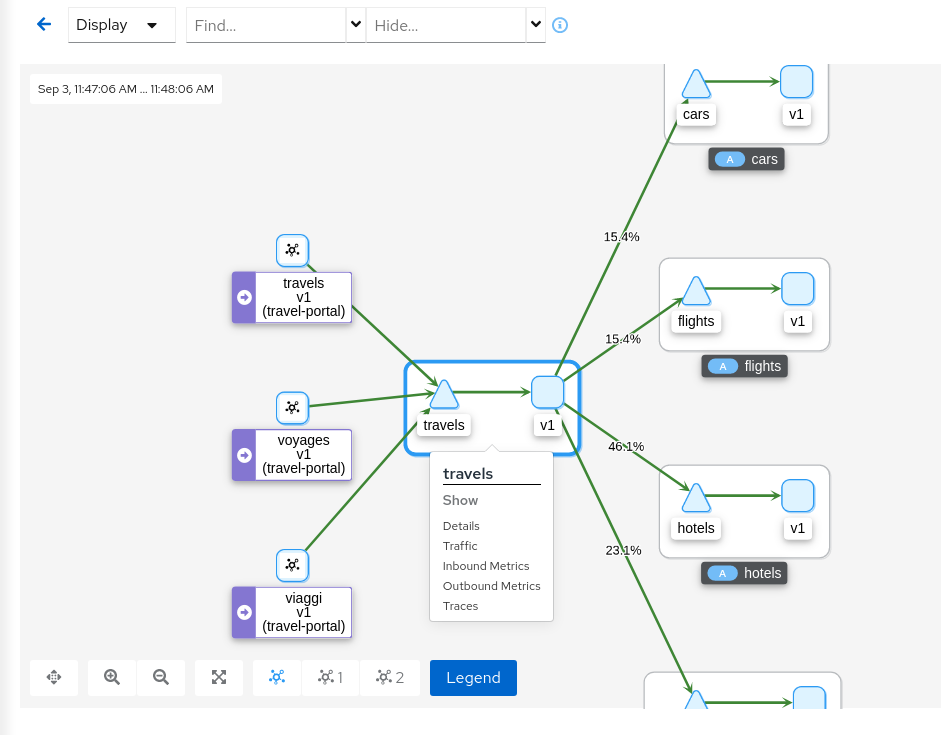
The graph can focus on an element to study a particular context in detail. Note that a contextual menu is available using right-click, to easily shortcut the navigation to other sections.
Application details
Kiali provides Detail Views to navigate into applications, workloads and services.
These views provide information about the structure, health, metrics, logs, traces and Istio configuration for any application component.
In this tutorial we are going to learn how to use them to examine the main travels application of our example.
Step 1
Navigate to the travels application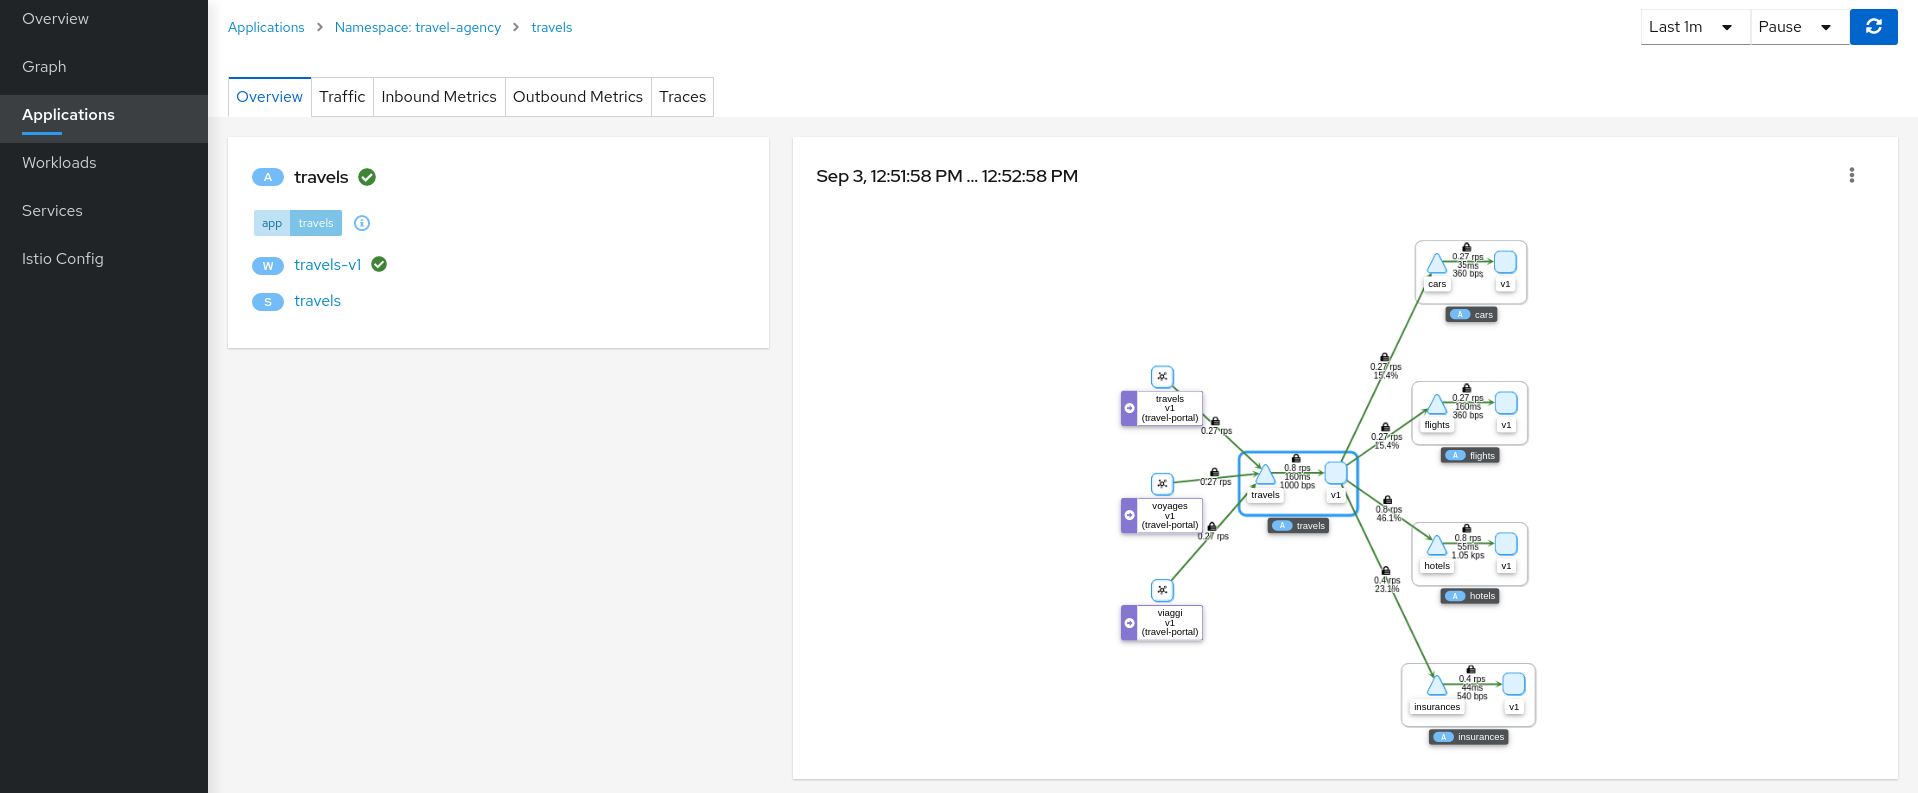
An application is an abstract group of workloads and services labeled with the same “application” name.
From Service Mesh perspective this concept is significant as telemetry and tracing signals are mainly grouped by “application” even if multiple workloads are involved.
At this point of the tutorial, the travels application is quite simple, just a travels-v1 workload exposed through the travels service. Navigate to the travels-v1 workload detail by clicking the link in the travels application overview.
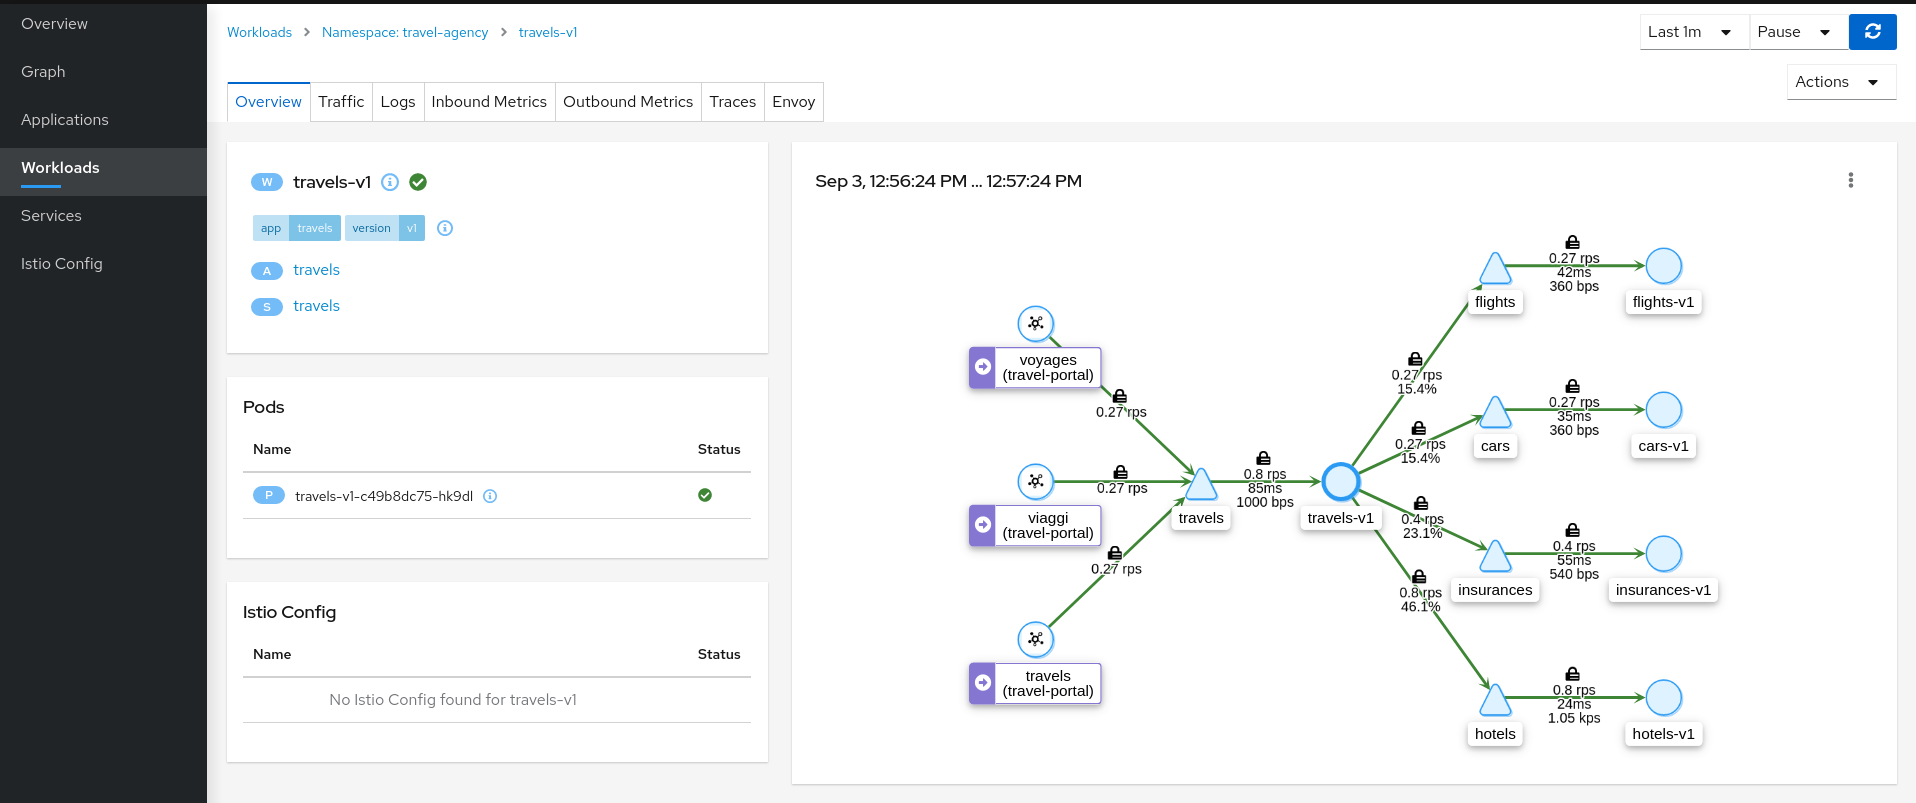
Step 2
Examine Outbound Metrics of travels-v1 workload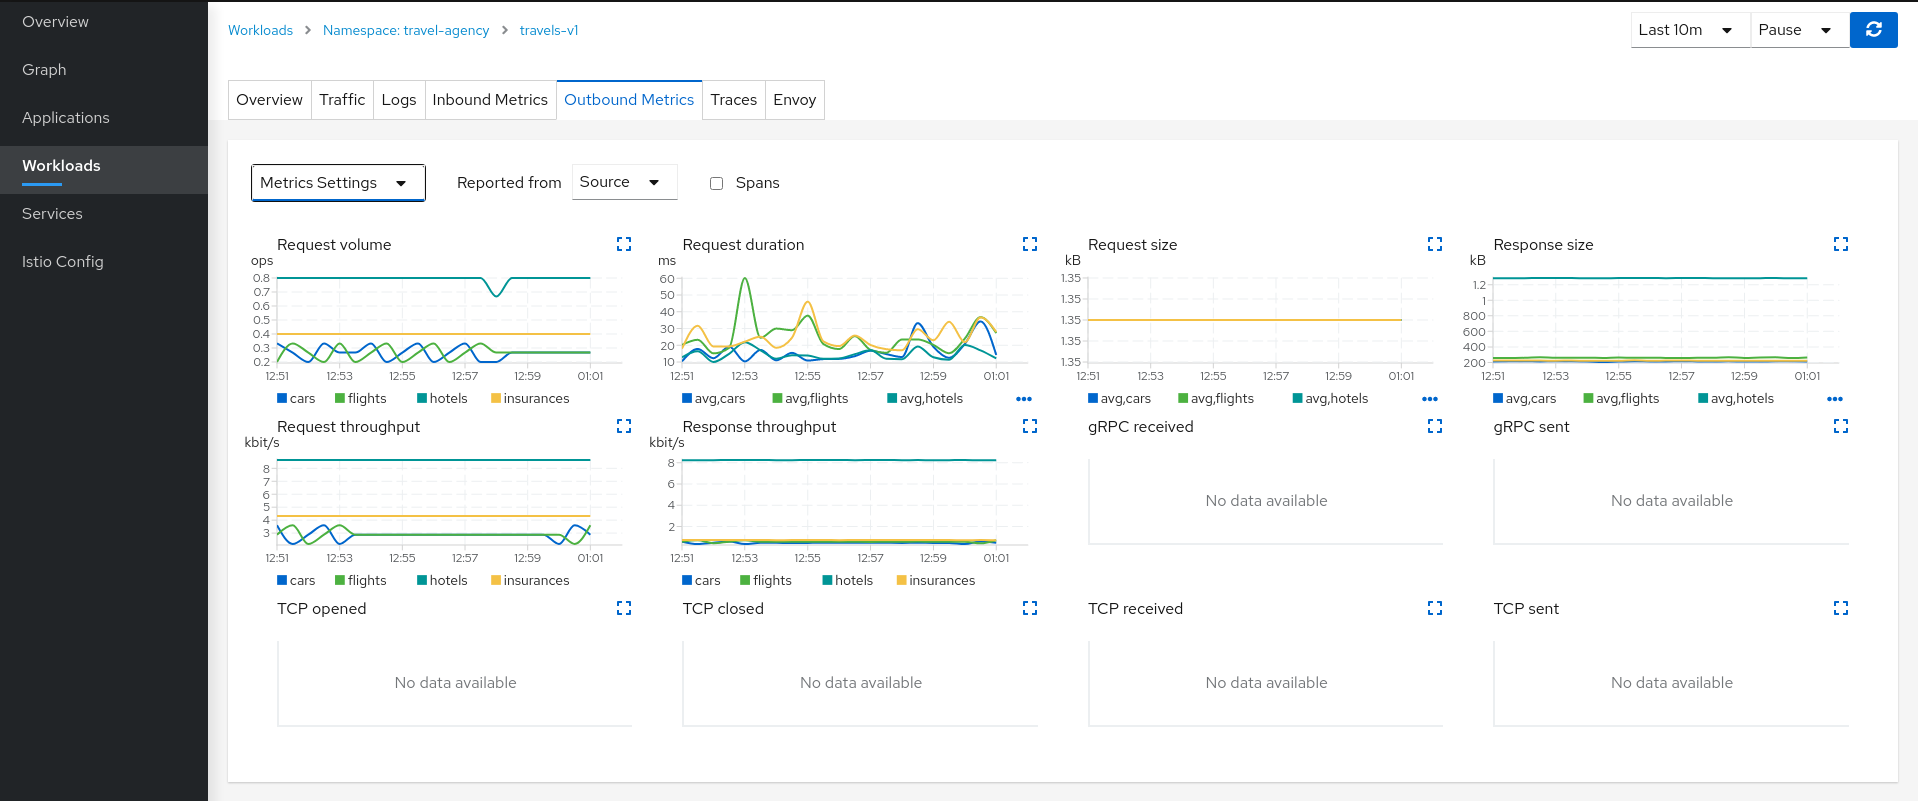
The Metrics tab provides a powerful visualization of telemetry collected by the Istio proxy sidecar. It presents a dashboard of charts, each of which can be expanded for closer inspection. Expand the Request volume chart:
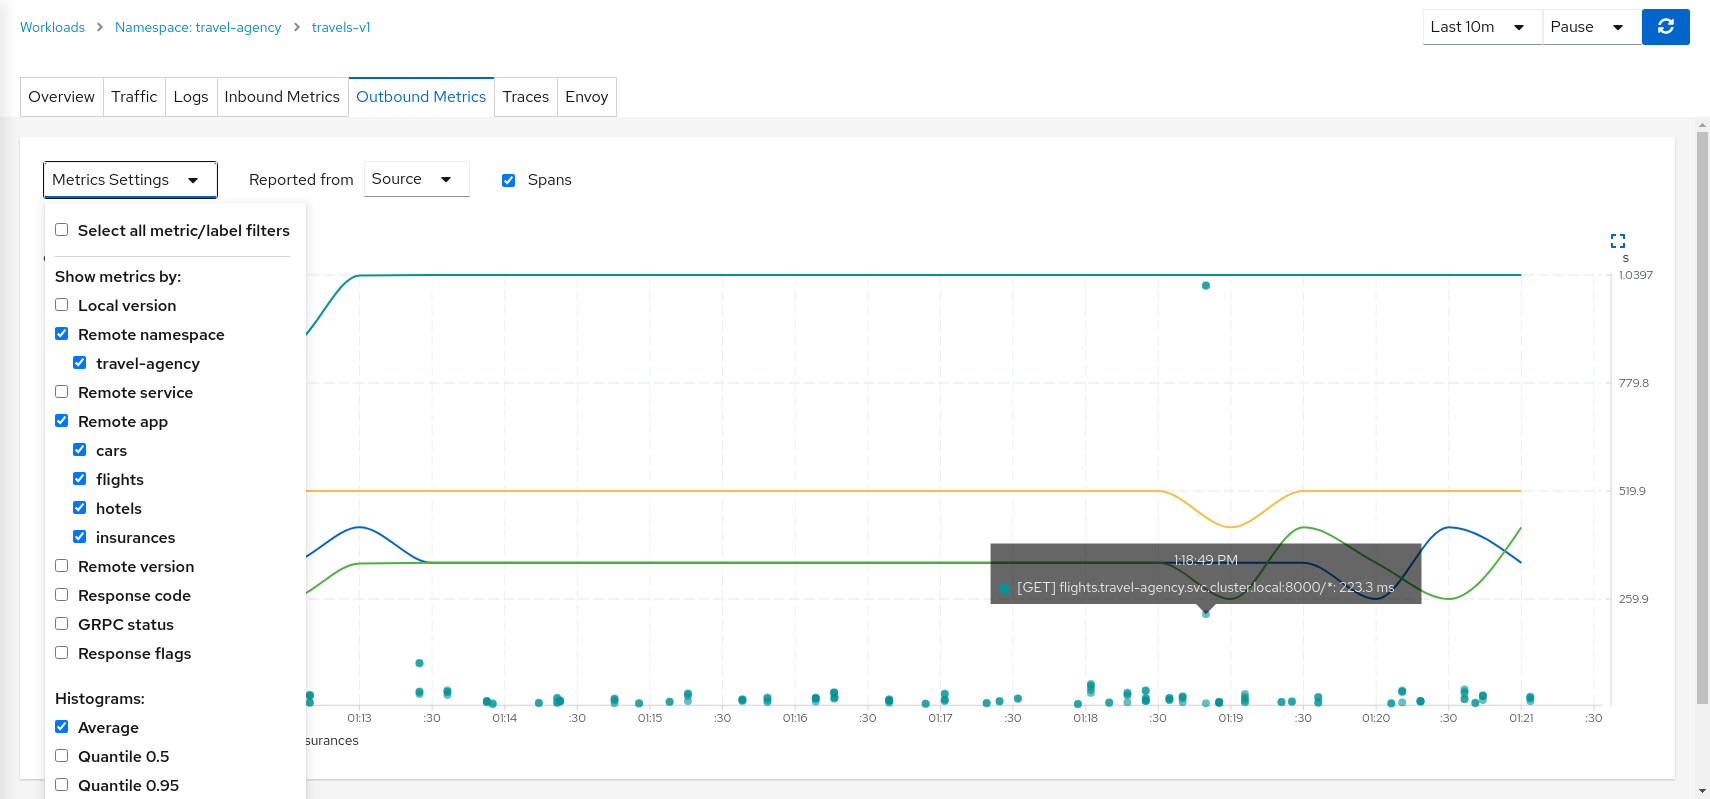
Metrics Settings provides multiple predefined criteria out-of-the-box. Additionally, enable the spans checkbox to correlate metrics and tracing spans in a single chart.
We can see in the context of the Travels application, the hotels service request volume differs from that of the other travel-agency services.
By examining the Request Duration chart also shows that there is no suspicious delay, so probably this asymmetric volume is part of the application business' logic.
Step 3
Review Logs of travels-v1 workloadThe Logs tab provides a unified view of application container logs with the Istio sidecar proxy logs. It also offers a spans checkbox, providing a correlated view of both logs and tracing, helping identify spans of interest.
From the application container log we can spot that there are two main business methods: GetDestinations and GetTravelQuote.
In the Istio sidecar proxy log we see that GetDestinations invokes a GET /hotels request without parameters.
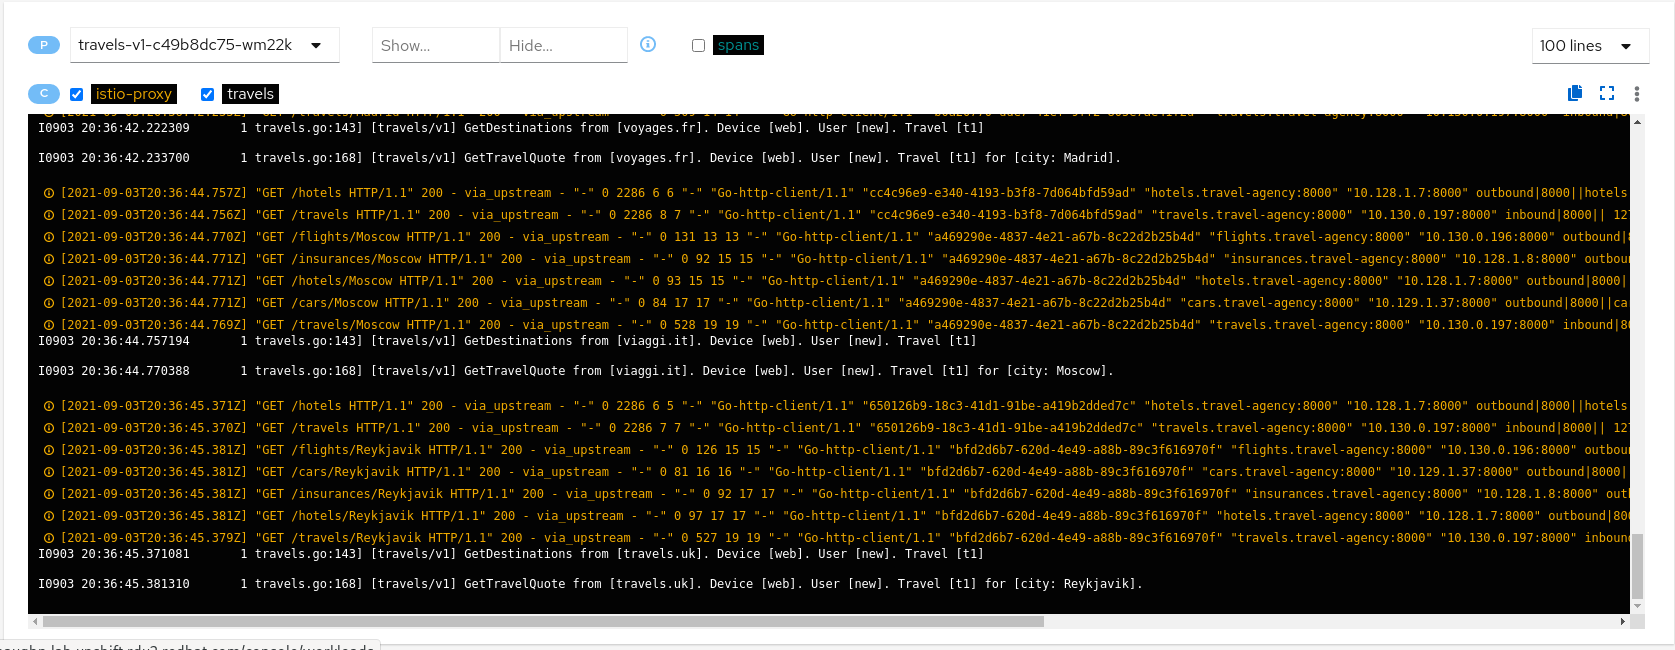
However, GetTravelQuote invokes multiple requests to other services using a specific city as a parameter.

Then, as discussed in the Travel Demo design, an initial query returns all available hotels before letting the user choose one and then get specific quotes for other destination services.
That scenario is shown in the increase of the hotels service utilization.
Step 4
Review Traces of workload-v1Now we have identified that the hotels service has more use than other travel-agency services.
The next step is to get more context to answer if some particular service is acting slower than expected.
The Traces tab allows comparison between traces and metrics histograms, letting the user determine if a particular spike is expected in the context of average values.

In the same context, individual spans can be compared in more detail, helping to identify a problematic step in the broader scenario.
